
Know what actually sold
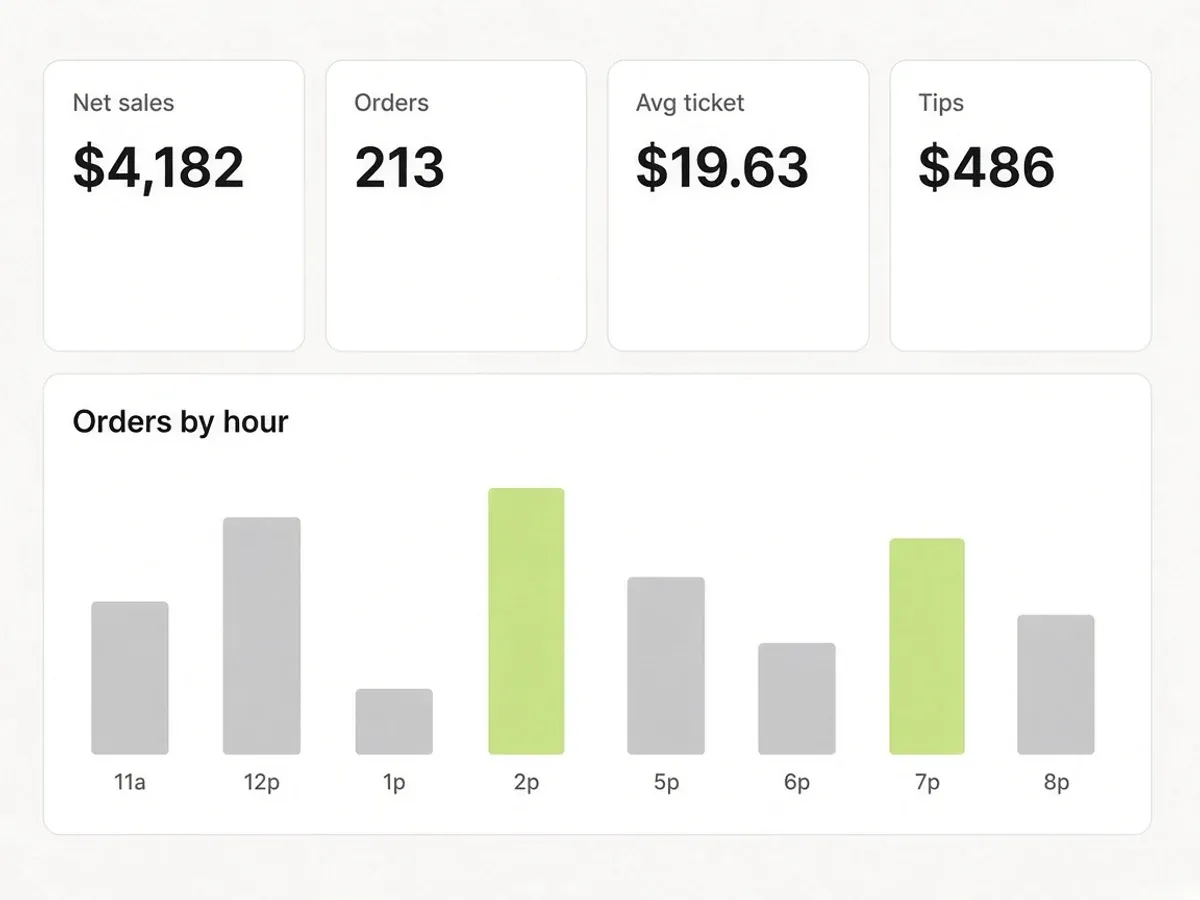
Net sales, tips, refunds, and average ticket across every channel. Then the useful part: which items move, when you are slammed, and who came back.
Trusted by food trucks, pop-ups, and independent kitchens


What reporting does Outbites include?
The Outbites dashboard reports net sales, taxes collected, tips, refunds, order count, and average ticket size for any date range and location. Beneath that it charts sales over time against the previous period, a peak-hours heatmap by day and hour, your top selling items, new versus returning customers, and a breakdown of orders by source, fulfilment method, and payment type.
How reporting and analytics works
Net sales, tips, refunds, and average ticket across every channel. Then the useful part: which items move, when you are slammed, and who came back.
- 01
The numbers that matter
Net sales, taxes, tips, refunds, orders, and average ticket, compared against the previous period so a number has context.
- 02
Peak hours
A heatmap by day and hour showing when the money actually comes in, which is usually not when you think.
- 03
Top selling items
What moves and what sits. Useful before you reprint a menu or decide what to prep.
Built for how service actually runs
No feature tier to climb. These come with the account.
The numbers that matter
Net sales, taxes, tips, refunds, orders, and average ticket, compared against the previous period so a number has context.
Peak hours
A heatmap by day and hour showing when the money actually comes in, which is usually not when you think.
Top selling items
What moves and what sits. Useful before you reprint a menu or decide what to prep.
New against returning
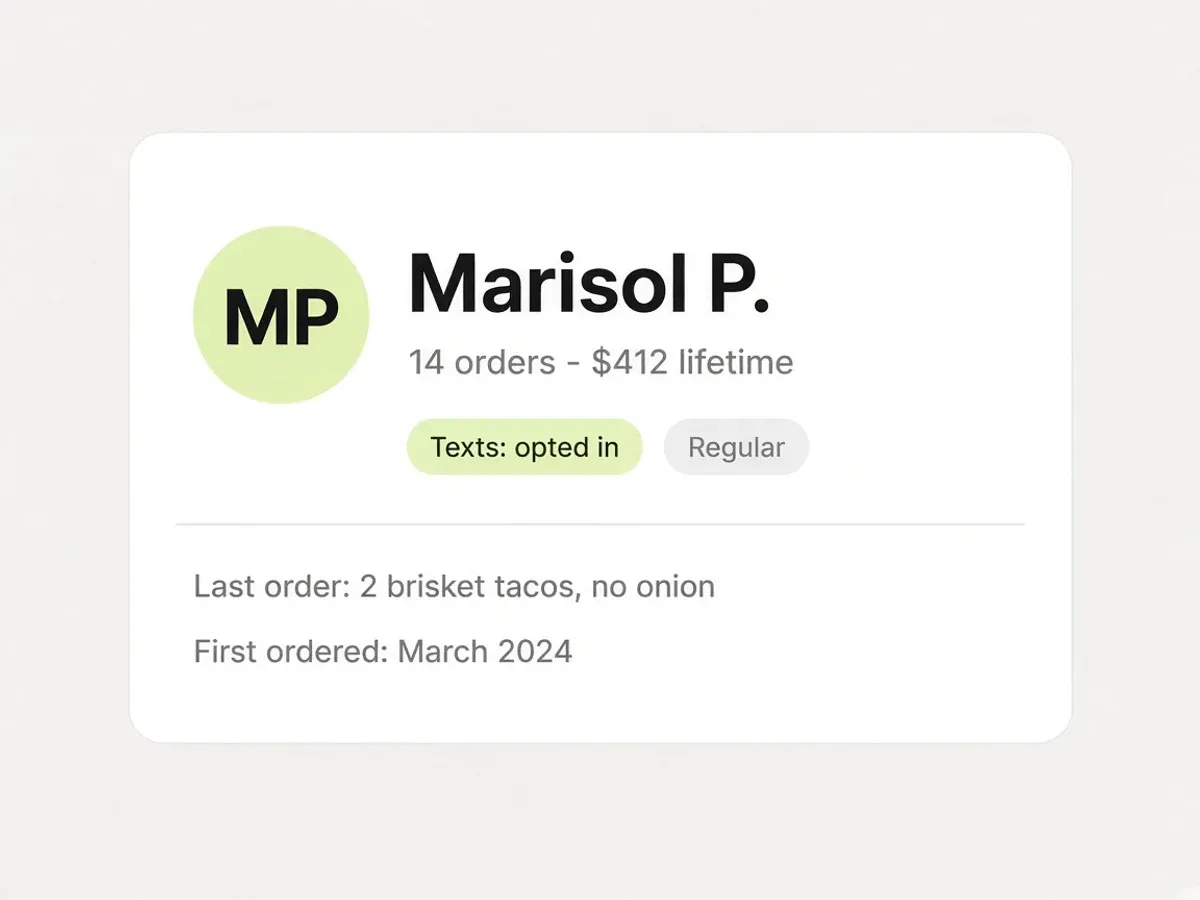
Whether you are renting attention or building regulars. This is the number that tells you if direct ordering is working.
Where orders come from
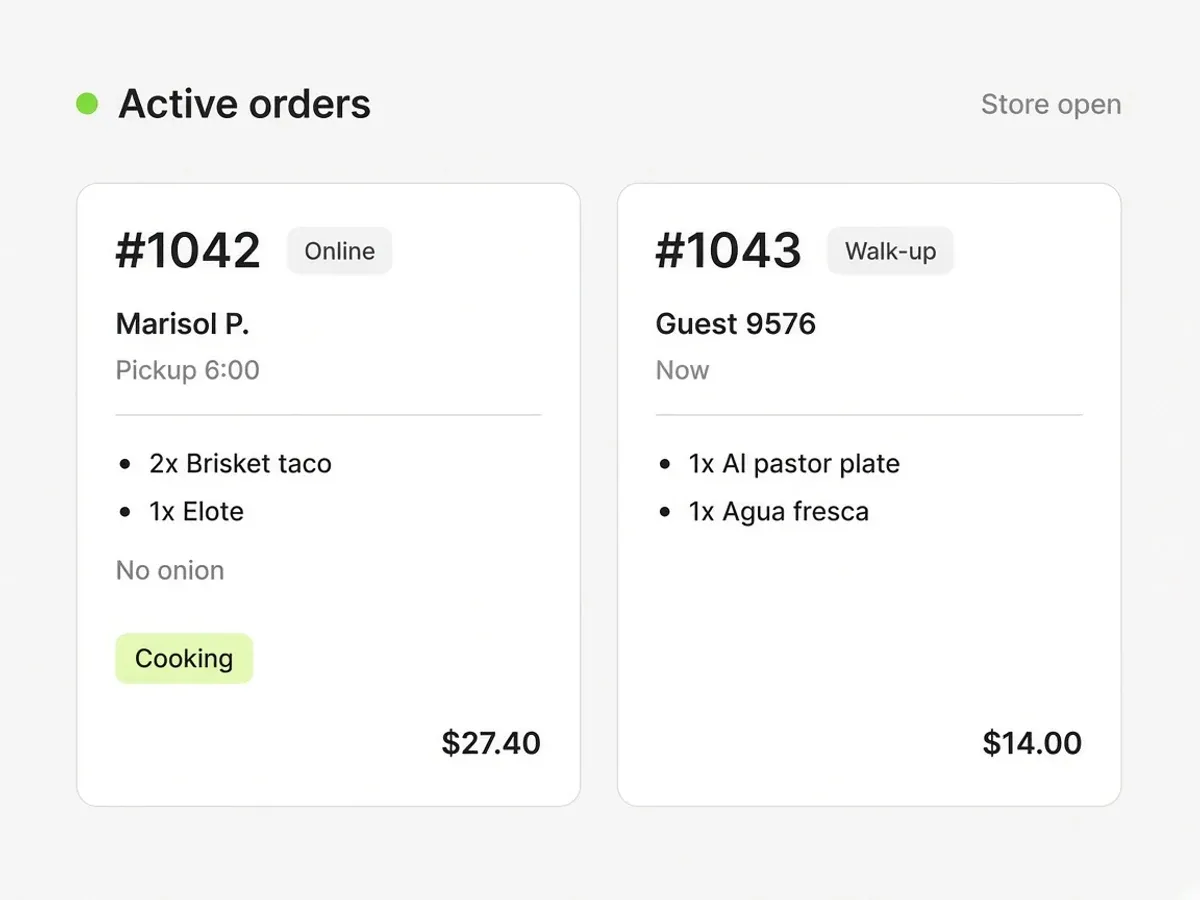
Online, counter, or kiosk, and pickup against delivery. Each ticket is tagged, so channel comparisons are real.
By location
Filter to one location or look across all of them when you run more than one.
Keep Square. Keep Stripe. Keep the printer.
Outbites is the register, the ordering page, and the kitchen tickets. Pair the card processor you already have. Tap on the phone. Print to the Bluetooth printer you already own. Dispatch a courier when you want one.
- SquareOnline, phone tap, and card reader
- StripeOnline card payments
- Apple PayWallet at checkout
- Google PayWallet at checkout
- DoorDash DriveA courier you dispatch
- Uber DirectA courier you dispatch
- GoogleSearch, Business Profile, Analytics
- Epson and StarBluetooth ticket printers
Frequently asked questions
What operators ask us about reporting and analytics.
Can I see sales by channel?
Yes. Every order is tagged with its source, so you can compare what came through your website against what was rung up at the counter or on a kiosk, and see the split between pickup and delivery.
Can I compare against last month?
Yes. The sales chart overlays the previous period for whatever date range you pick, and the summary figures show the percentage change.
Food businesses taking orders on their own link
Named Austin kitchens, in their own words.
“This is the first stack that actually moved the needle on direct online revenue.”
Aisha B.
“Less money lost to middlemen and a lot more orders coming straight to us.”
Renee J.
“Branded ordering on our own site. Guests notice and the average ticket keeps climbing.”
Grace C.
“Service runs tighter. Fewer fire drills on the line and fewer missed calls up front.”
Andre Z.
“We keep the full ticket on pickup, and delivery costs stay small and predictable.”
Maya V.
“We close late. I have never waited long for a real person when something breaks.”
Luis O.
“We are steering volume off third-party marketplaces and putting dollars back in-house.”
Chris D.
“It helps independents stand next to the chains without a seven-figure tech budget.”
Tara E.
“Setup was painless. Online sales picked up faster than we budgeted for.”
James W.
“Orders go out smoothly and our promos are finally getting real traction.”
Elena R.
“We outgrew our old DIY site. Web sales are up well over half year over year.”
Ben Y.
“Our site finally matches the restaurant, and someone walked us through every tweak.”
Sofia M.
“I'm a vampire. The truck only parks after dark, garlic is off the menu, and guests still order from the QR on the window.”
Lenore V.
Trusted by food trucks, pop-ups, and independent kitchens
Try it on your own menu
Create an account, add one item, and see how this works with your actual food.
- $1 per fulfilled order
- No monthly platform fee
- We never hold your payouts
- Cancel anytime